A modern terrestrial LiDAR scanner fires up to one million laser pulses per second. Each pulse travels at the speed of light, strikes a surface, and returns to the sensor the elapsed time measured with nanosecond precision to calculate an exact distance. Do that a million times a second across a full building, a road corridor, or an open terrain site, and within minutes you have a dataset of staggering density and detail. The scan is extraordinary. What happens next: turning that raw data into a professional deliverable inside AutoCAD, is where the real challenge begins.
Understanding LiDAR technology properly isn't just technical curiosity. For CAD professionals who work with point cloud data, it directly informs how you capture, manage, and process scan data more effectively. And it explains exactly why the tools you use to handle it matter as much as the scanner that produced it.
What is LiDAR and How It Creates a Point Cloud
 LiDAR stands for Light Detection and Ranging. It works on the same principle as radar, but instead of radio waves, it uses laser light (typically in the near-infrared spectrum) to measure distances with extraordinary precision.
The core physics is simple. A laser pulse is emitted. It hits the surface. It returns to the sensor. The distance is calculated using the formula: Distance = Speed of Light X Time of Flight / 2 .
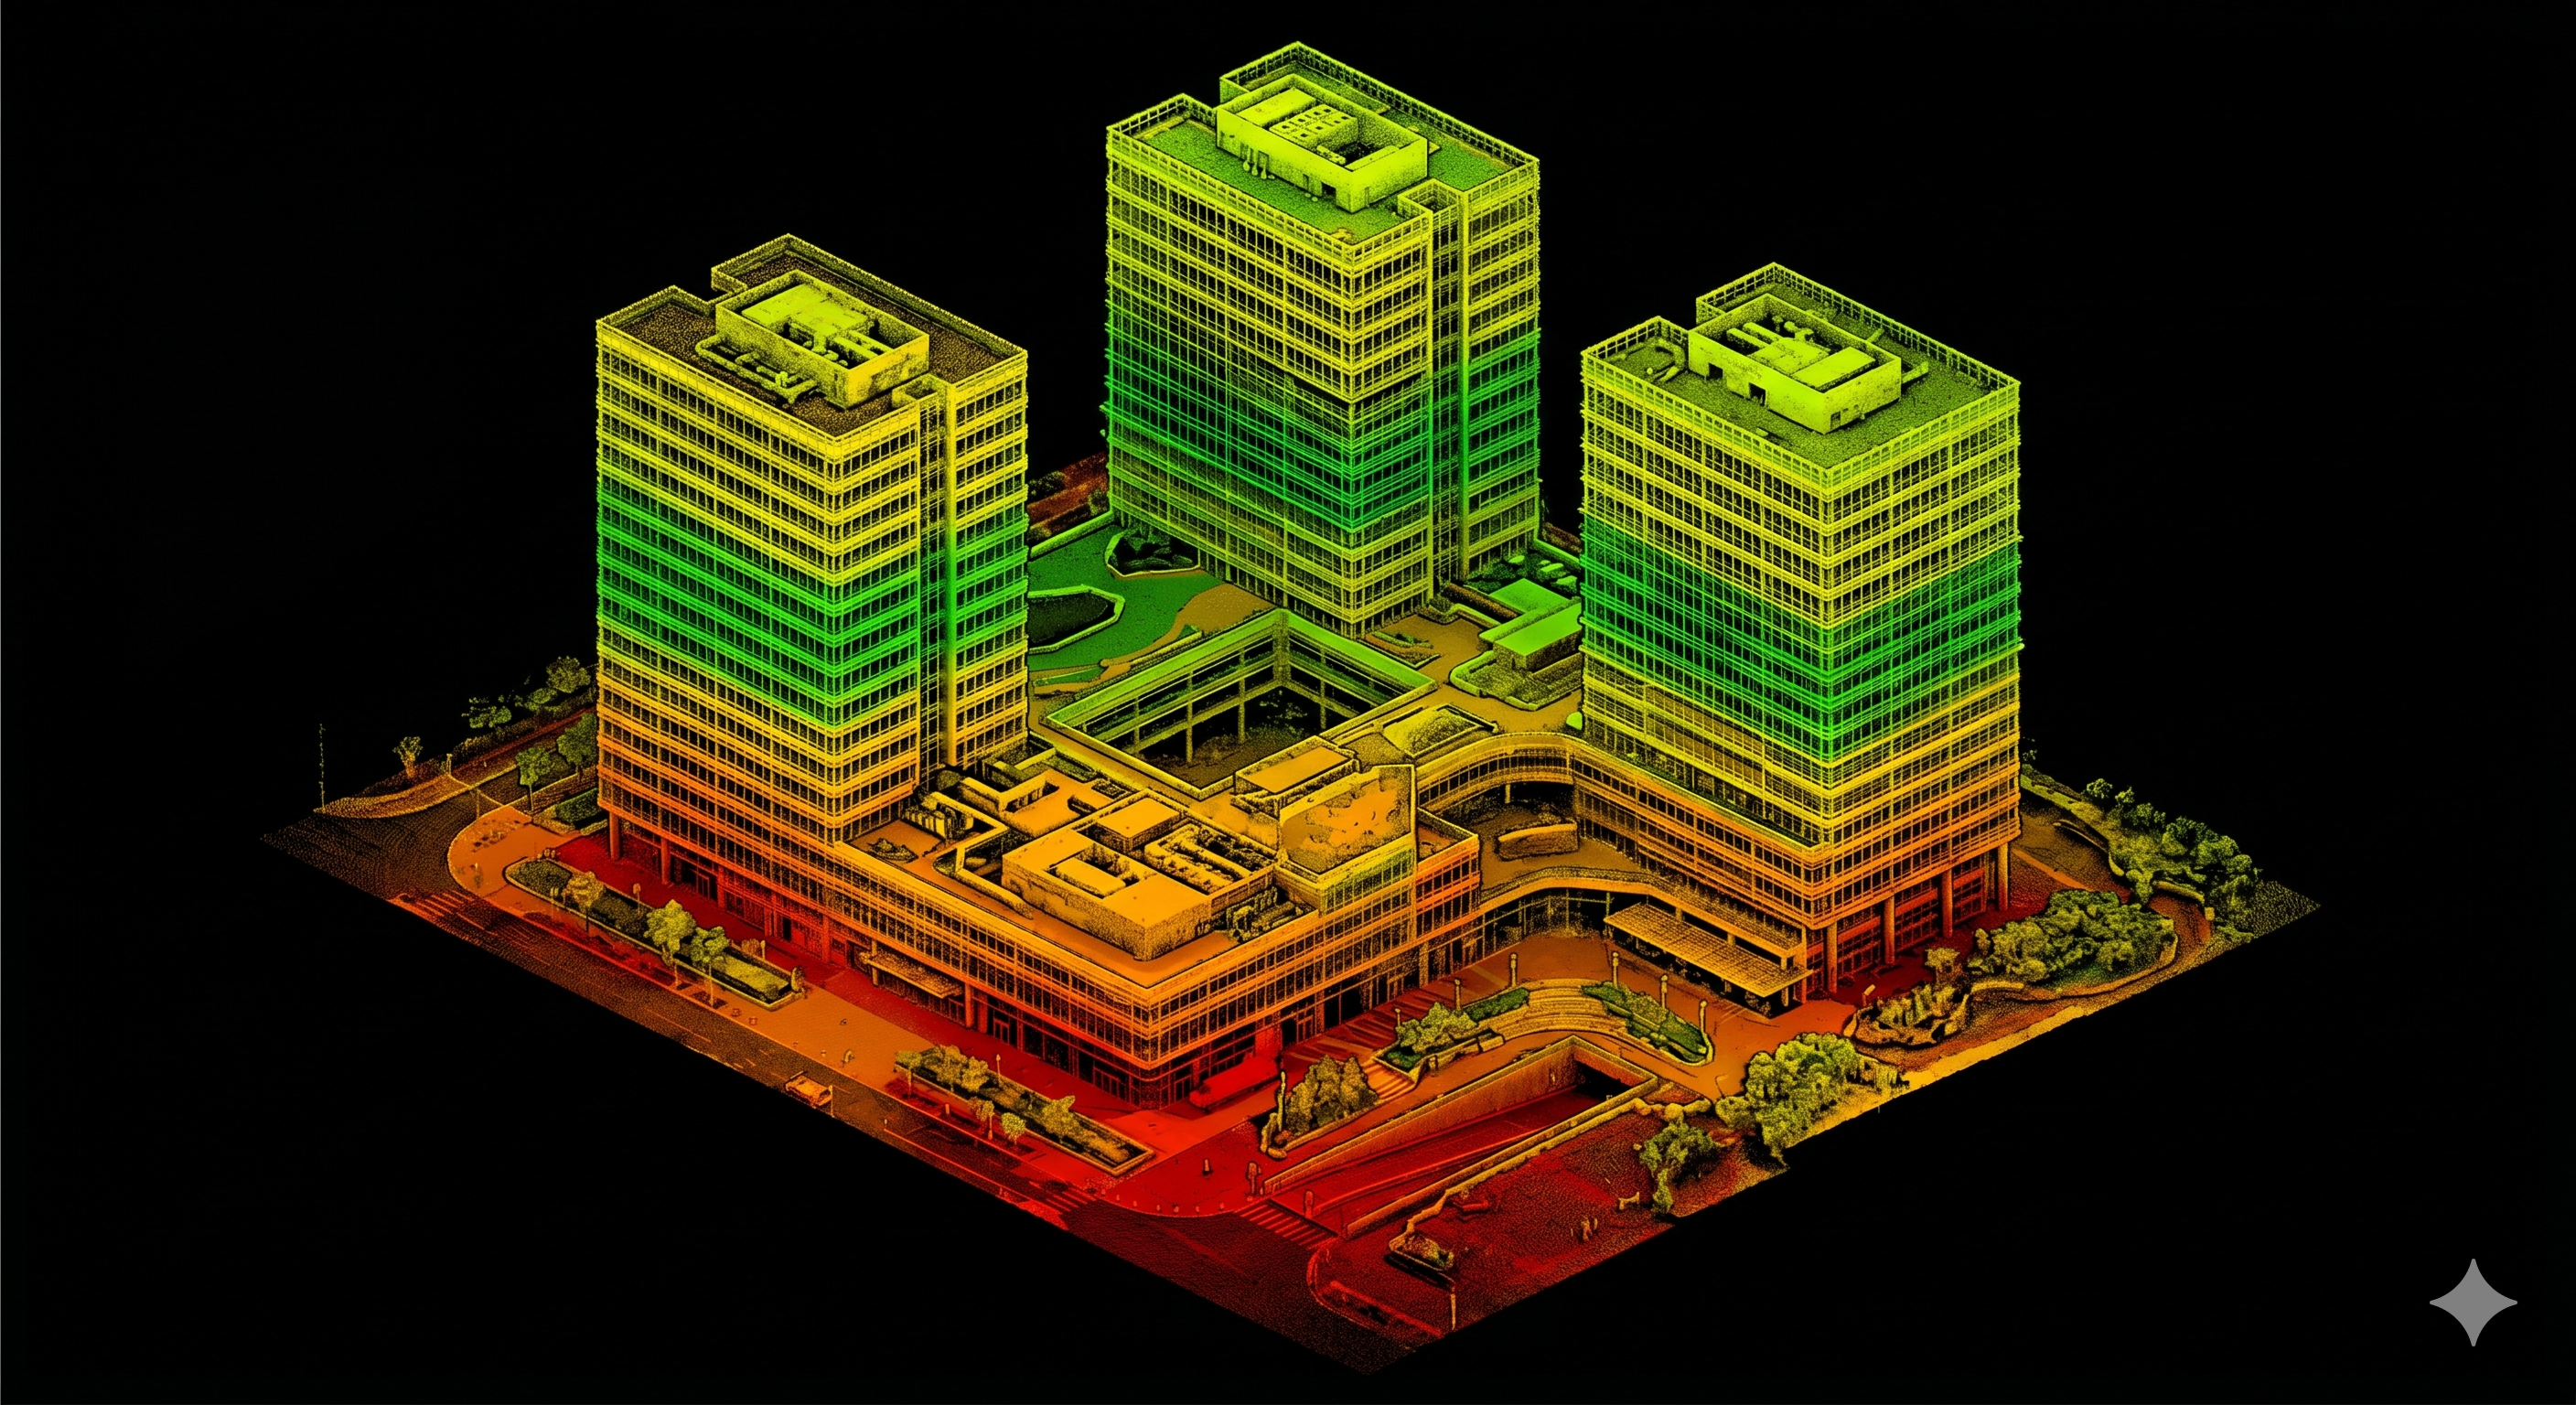
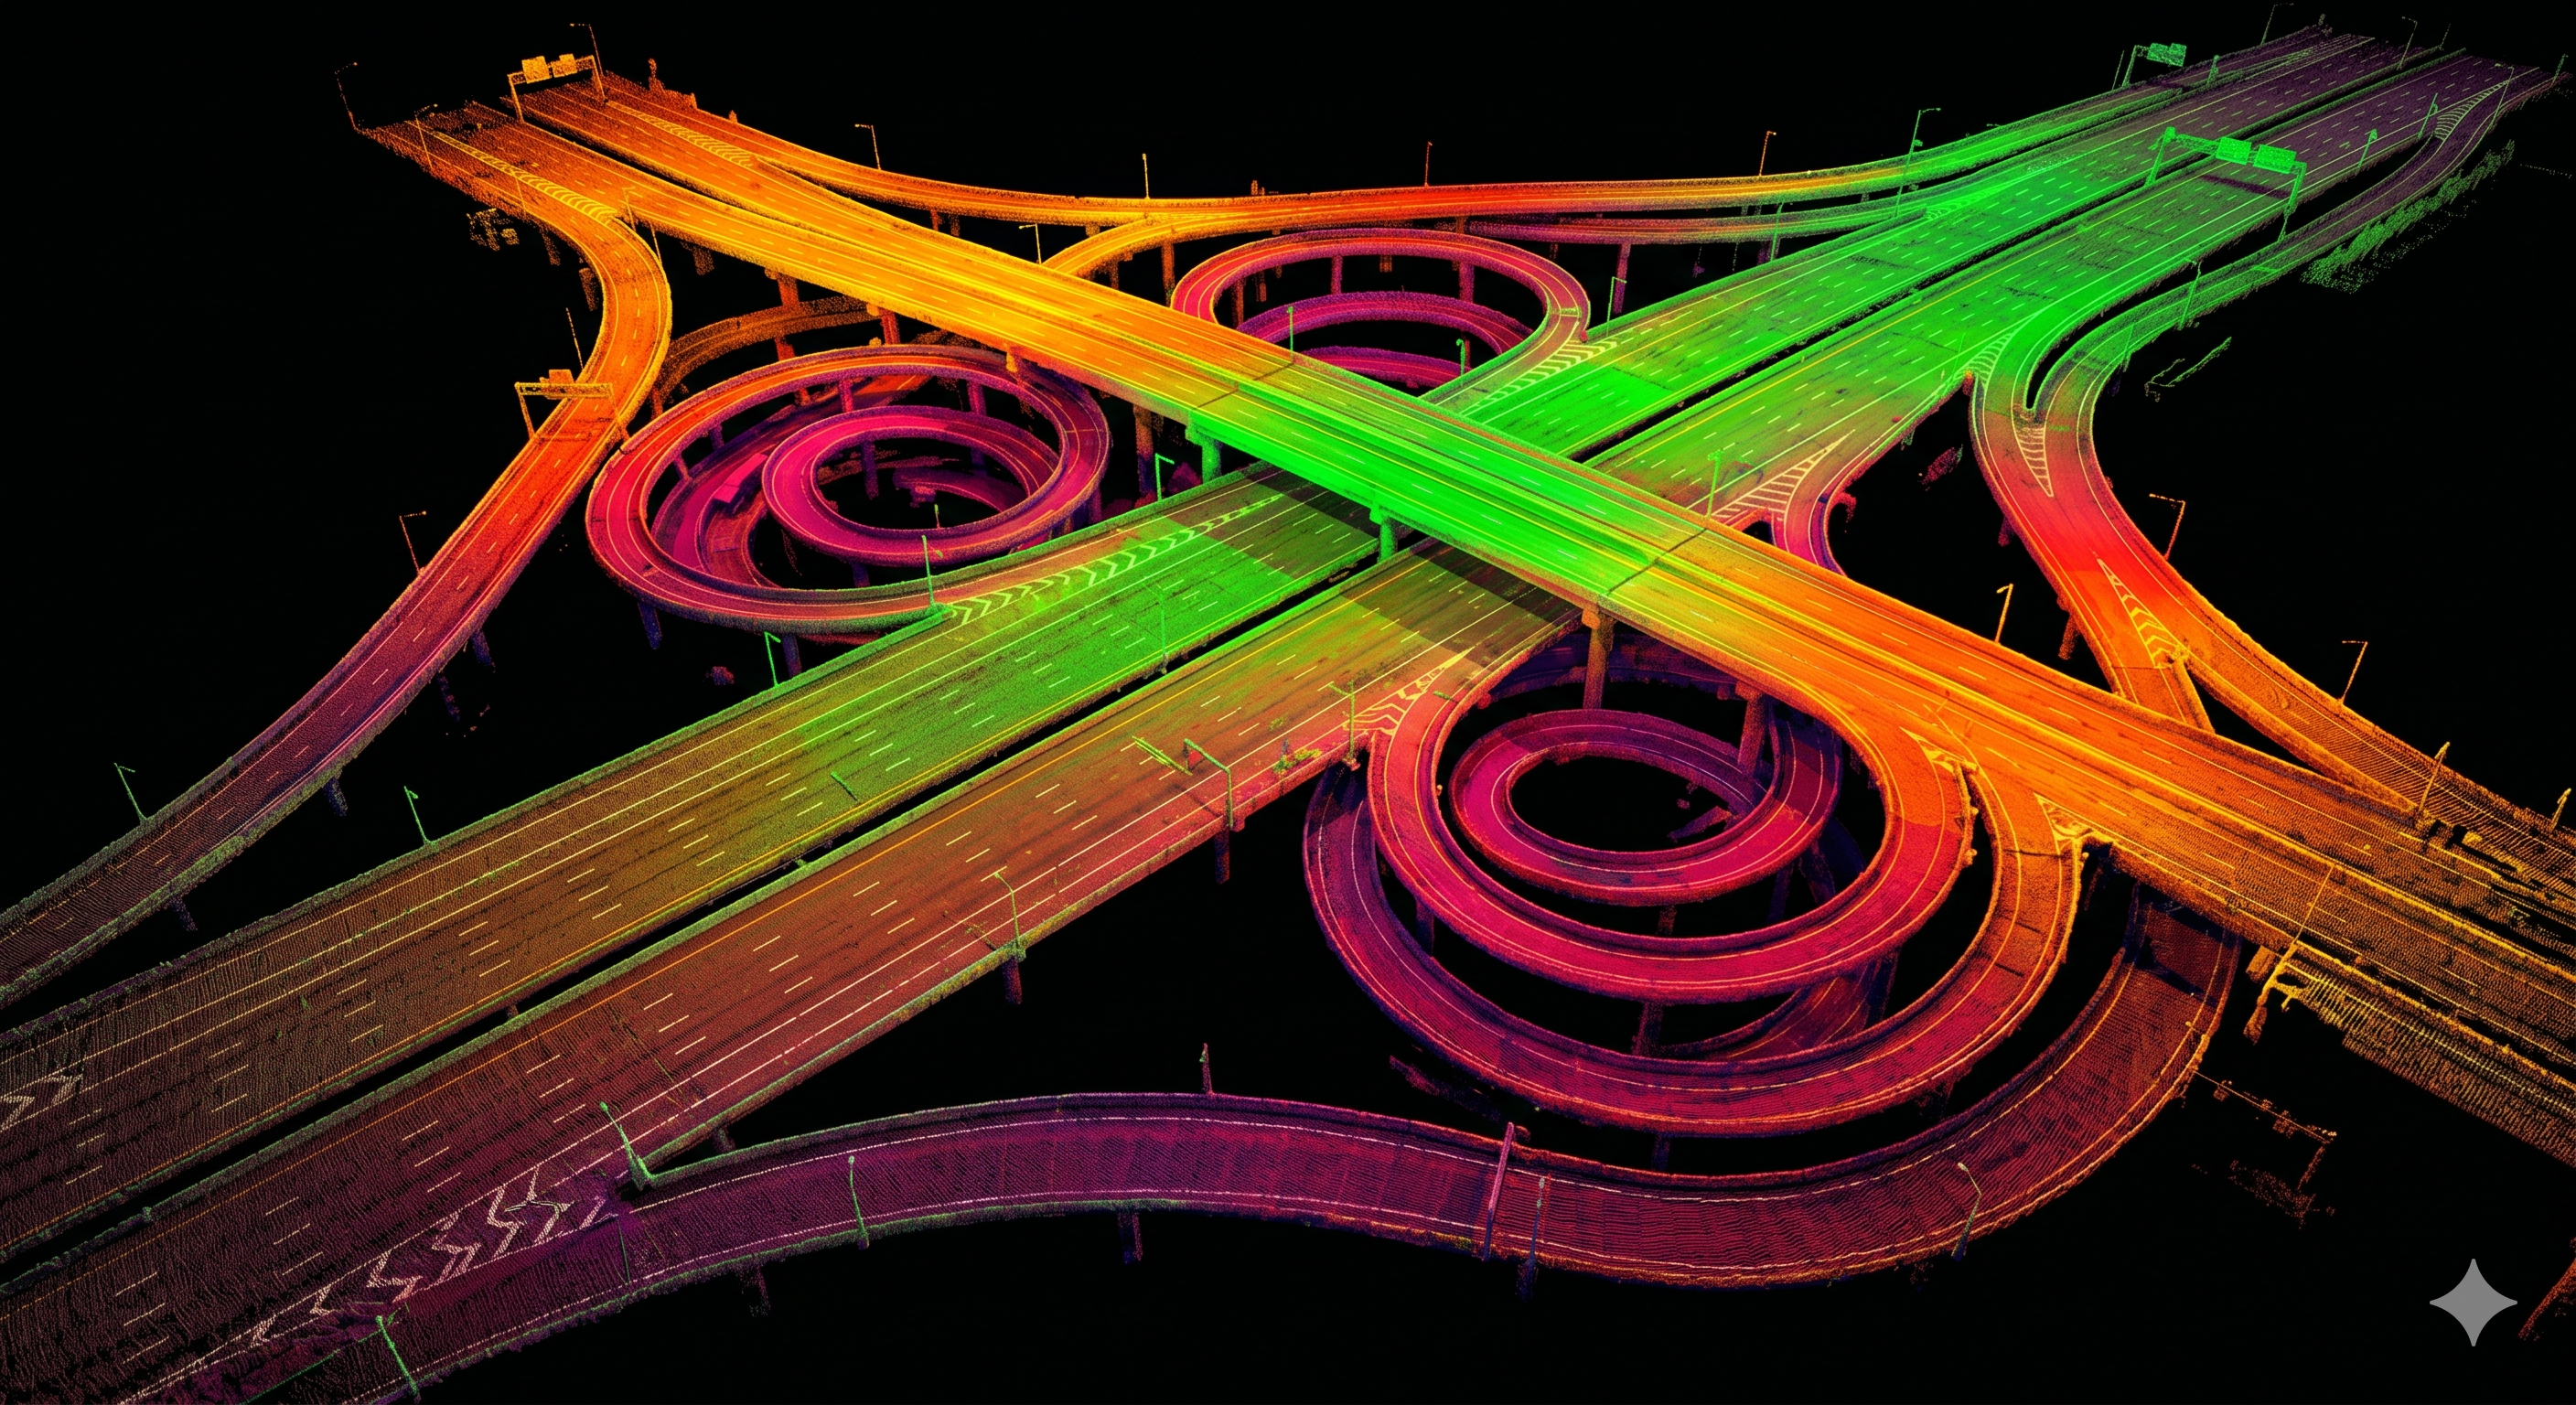
Multiply that single measurement by millions of pulses across a full scan session, each aimed at a slightly different angle by a rotating or oscillating mirror system, and the result is a point cloud: a three-dimensional collection of measured coordinate points, each representing a precise location on a real-world surface.
Each point in that cloud carries more than just geometry. Depending on the scanner and configuration, individual points can store:
- X, Y, Z coordinates - the precise 3D position in space.
- Intensity value - the strength of the laser return, which reflects material properties and surface texture.
- RGB color values - where scanners are paired with integrated cameras.
- Return number - in systems that record multiple returns per pulse, useful for vegetation penetration and canopy modeling.
- GPS timestamp - for mobile and airborne systems that record position as the platform moves.
This richness of data per point is what makes LiDAR outputs so much more useful than simple geometry capture. A point cloud isn't just a shape. It's a spatially indexed database of the physical world.
The Three Primary LiDAR Capture Methods
Not all LiDAR data is created the same way. The capture method determines the density, coverage, accuracy, and file size of the resulting point cloud and therefore influences how it needs to be processed.
| Capture Method | Platform | Typical Application | Point Density |
|---|---|---|---|
| Terrestrial LiDAR | Tripod-mounted scanner | Buildings, facades, interiors, infrastructure | Very high: billions of points per scan session |
| Mobile LiDAR | Vehicle-mounted system | Road corridors, urban mapping, utilities | High: continuous capture over distance |
| Airborne / UAV LiDAR | Aircraft or drone | Topography, large sites, forestry, coastal mapping | Medium: wide area, lower density than terrestrial |
Each method produces data in its own format and at its own scale. A single terrestrial scan session of a complex building can generate datasets ranging from 1-5 GB for small interior spaces to over 100 GB for large infrastructure projects. Airborne and mobile systems capturing large corridors can produce datasets running into terabytes. These are not small files to open casually in CAD software.
From Raw Scan to Usable File: The Processing Pipeline
Raw LiDAR data doesn't arrive in AutoCAD directly. It goes through a processing pipeline first, and understanding that pipeline helps explain what you're working with by the time the data arrives in your drawing.
Step 1: Raw data capture
The scanner records millions of distance measurements along with all associated metadata: intensity, GPS position, return count. This raw data is stored in the scanner's native format, which varies by manufacturer.
Step 2: Registration and alignment
For multi-scan projects, where the scanner is repositioned multiple times to capture different areas or reduce occlusion, the individual scans must be aligned into a single unified coordinate system. This is called registration, and it's typically done in dedicated scan processing software.
Step 3: Classification and noise filtering
Raw point clouds contain noise: erroneous points from atmospheric scatter, moving objects, reflective surfaces, and sensor artifacts. Classification algorithms separate points into categories: ground, vegetation, buildings, water, noise. Filtered datasets are cleaner and far more manageable to work with.
Step 4: Conversion to AutoCAD compatible formats
The cleaned, registered scan data is converted into .RCS or .RCP format using Autodesk ReCap, which compresses and indexes the data for efficient display and querying inside AutoCAD. This indexing is what allows AutoCAD to display millions of points in real time without loading the entire dataset into memory simultaneously.
The Real Challenge: Why LiDAR Datasets Push AutoCAD to Its Limits
 This is the part that doesn't make it into most LiDAR marketing materials. The scans are impressive. The data is accurate. But a point cloud file containing hundreds of millions of points, which is entirely routine for any serious survey project, places an enormous demand on both hardware and software.
The challenges are practical and immediate:
- File size - large infrastructure project point clouds regularly exceed 100 GB. Working with datasets of this size in real time requires optimized software that doesn't attempt to load everything into memory at once.
- Visual complexity - a full building scan viewed without any filtering or isolation is often visually impenetrable. Millions of points from walls, ceilings, floors, furniture, and external structures overlap in 3D space, making it extremely difficult to identify the specific geometry you need.
- Computational load - processing operations on large point clouds (filtering, surface generation, section cutting) require significant CPU and GPU resources. Without optimized algorithms, these operations are slow or fail entirely on standard workstation hardware.
- Data noise - even after classification, real-world scan data contains reflections, occlusion edges, moving object artifacts, and atmospheric noise that must be managed before accurate geometry can be extracted.
These challenges don't make LiDAR less valuable. They make the choice of processing tool more important. AutoCAD's native point cloud capabilities handle the basics (attachment, display, basic clipping), but they were not designed to address this level of data complexity at the professional processing level.
Why VEGA Is Built for Exactly This Problem
VEGA was designed specifically for the kind of point cloud data that LiDAR produces: large, dense, information-rich, and demanding. Its tools address each of the challenges described above directly, within AutoCAD, without requiring the user to move data to external platforms or invest in separate specialist software.
Here's how VEGA addresses the specific demands of LiDAR datasets:
Managing Visual Complexity: Dynamic Slicing
VEGA's dynamic slicing tool cuts an interactive plane through the point cloud in real time, isolating only the data at the elevation or depth you're working with. For a dense LiDAR scan of a multi-storey building, this means working from a clean, focused cross-section rather than a visually overwhelming full cloud. The slice moves instantly as you adjust it - no recalculation, no waiting.
Handling Ground Noise: Automated Ground Detection
One of the most common post-processing tasks after a LiDAR terrain scan is separating ground points from non-ground points: removing trees, vehicles, structures, and atmospheric returns to isolate the actual terrain surface. VEGA's automated ground detection and filtering handles this directly inside AutoCAD, automatically identifying and removing non-ground elements and leaving a clean surface ready for DTM and TIN generation.
Turning Dense Data into Terrain Products: TIN and DTM Generation
Once the ground surface is clean, VEGA generates TIN surfaces and DTMs directly from the point cloud within AutoCAD. This takes a dataset that could contain billions of measured ground points and converts it into a structured, usable terrain surface from which contour lines, profiles, cross-sections, and volume calculations can be derived - all without leaving the AutoCAD session.
Extracting Geometry without Manual Tracing: Specialist Tools
VEGA's purpose-built extraction tools: the double line tool, cylindrical section detection, linear section profiling, facade elevation projection - are designed to pull precise geometry from dense point cloud data efficiently and accurately. Where AutoCAD's generic drawing tools require manual visual interpretation of complex scan data, VEGA's tools are calibrated for the geometry types that LiDAR surveys most commonly produce: walls, pipes, road edges, terrain breaks, and facade planes.
LiDAR's Growing Role and Why Workflow Matters More Than Ever
The LiDAR market is expanding at a rate that makes this conversation increasingly relevant to every CAD professional. The global LiDAR market was valued at USD 3.27 billion in 2025 and is projected to reach USD 12.79 billion by 2030, growing at a CAGR of 31.3%. Corridor mapping alone commanded 37.6% of the 2025 LiDAR market, reflecting the enormous volume of infrastructure survey work being conducted with LiDAR systems globally.
What this growth means practically is that LiDAR-generated point cloud data is becoming a routine input to AEC workflows, not an occasional specialist deliverable. Surveyors, engineers, and architects who don't have an efficient, professional-grade workflow for processing that data are already behind. The question is no longer whether you'll encounter LiDAR datasets. It's whether your tools can handle them.
The Full Picture: LiDAR In, Professional Drawing Out
The journey from LiDAR pulse to finished AutoCAD drawing crosses several stages: data capture, registration, classification, format conversion, and finally professional processing and drafting. Each stage matters. But the last stage, where the clean, indexed point cloud meets the CAD professional who needs to turn it into a deliverable - is where skill, workflow, and tools converge.
VEGA is built for that final stage. It doesn't replace the scanner, the registration software, or AutoCAD. It completes the chain - providing the specialized processing intelligence that transforms dense LiDAR data into terrain models, floor plans, facade drawings, road maps, and infrastructure documentation, entirely within the AutoCAD environment that professionals already know.
For CAD professionals working with LiDAR data (or preparing to) understanding technology is the first step. Having the right tools to act on it is the second. You can download VEGA free trial version and have a look at the demo video library that covers every major workflow from scan attachment to finished deliverable.
FAQ: LiDAR Technology and Point Cloud Processing in AutoCAD
What is LiDAR and how does it create a point cloud?
What file formats does LiDAR data come in and how do you use them in AutoCAD?
Why are LiDAR point cloud datasets so difficult to work with in AutoCAD?
What is the difference between a DTM and a DEM in LiDAR processing?
How does VEGA help process large LiDAR datasets inside AutoCAD?
How does LiDAR handle occlusion, and what does it mean for survey completeness in AutoCAD workflows?
In AutoCAD workflows, unresolved occlusion shows up as missing wall segments, incomplete terrain surfaces, and partial pipe arcs - all of which affect the accuracy and completeness of the final deliverable. This is why scan planning matters as much as scan processing: the best tools, including VEGA, can only work with the data that was captured. A well-planned multi-position scan with deliberate occlusion management is the foundation that makes accurate AutoCAD deliverables possible.